目录
解释机器学习模型是一个困难的过程,因为通常大多数模型都是一个黑匣子,我们不知道模型内部发生了什么。创建不同类型的可视化有助于理解模型是如何执行的,但是很少有库可以用来解释模型是如何工作的。
Evidently 是一个开源 Python 库,用于创建交互式可视化报告、仪表板和 JSON 配置文件,有助于在验证和预测期间分析机器学习模型。它可以创建 6 种不同类型的报告,这些报告与数据漂移、分类或回归的模型性能等有关。
让我们开始吧
1、安装包
使用 pip 软件包管理器安装,运行
$ pip install evidently该工具允许在 Jupyter notebook 中以及作为单独的HTML文件构建交互式报告。如果你只想将交互式报告生成为HTML文件或导出为JSON配置文件,则安装现已完成。
为了能够在 Jupyter notebook 中构建交互式报告,我们使用Jupyter nbextension。如果想在 Jupyter notebook 中创建报告,那么在安装之后,您应该在 terminal 中运行以下两个命令。
要安装 jupyter Nbextion,请运行:
$ jupyter nbextension install --sys-prefix --symlink --overwrite --py evidently运行
jupyter nbextension enable evidently --py --sys-prefix有一点需要注意:安装后单次运行就足够了。无需每次都重复最后两个命令。
2、导入所需的库
在这一步中,我们将导入创建ML模型所需的库。我们还将导入用于创建用于分析模型性能的仪表板的库。此外,我们将导入 pandas 以加载数据集。
import pandas as pd
import numpy as np
from sklearn.ensemble import RandomForestRegressor
from evidently.dashboard import Dashboard
from evidently.tabs import RegressionPerformanceTab
from evidently.model_profile import Profile
from evidently.profile_sections import RegressionPerformanceProfileSection
3、加载数据集
在这一步中,我们将加载数据并将其分离为参考数据和预测数据。
raw_data = pd.read_csv('/content/day.csv', header = 0, sep = ',', parse_dates=['dteday'])
ref_data = raw_data[:120]
prod_data = raw_data[120:150]
ref_data.head()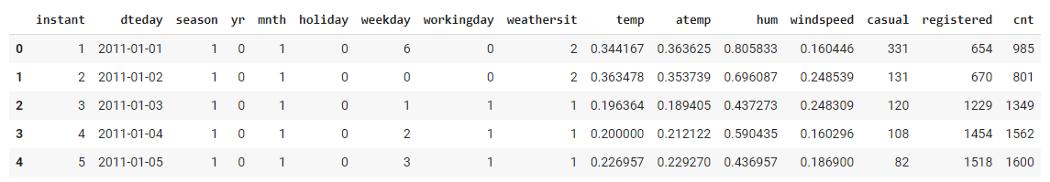
4、创建模型
在这一步中,我们将创建机器学习模型,对于这个特定的数据集,我们将使用随机森林回归模型。
target = 'cnt'
datetime = 'dteday'
numerical_features = ['mnth', 'temp', 'atemp', 'hum', 'windspeed']
categorical_features = ['season', 'holiday', 'weekday', 'workingday', 'weathersit',]
features = numerical_features + categorical_features
model = RandomForestRegressor(random_state = 0)
model.fit(ref_data[features], ref_data[target])
ref_data['prediction']  = model.predict(ref_data[features])
prod_data['prediction'] = model.predict(prod_data[features])
5、创建仪表板
在这一步中,我们将创建仪表板来解释模型性能并分析模型的不同属性,如 MAE、MAPE、误差分布等。
column_mapping = {}
column_mapping['target'] = target
column_mapping['prediction'] = 'prediction'
column_mapping['datetime'] = datetime
column_mapping['numerical_features'] = numerical_features
column_mapping['categorical_features'] = categorical_features
dashboard = Dashboard(tabs=[RegressionPerformanceTab])
dashboard .calculate(ref_data, prod_data, column_mapping=column_mapping)
dashboard.save('bike_sharing_demand_model_perfomance.html')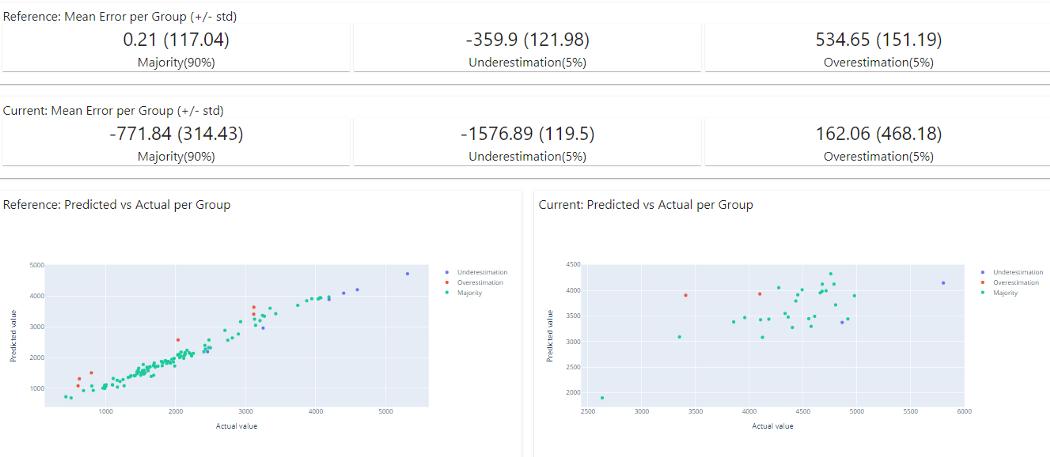
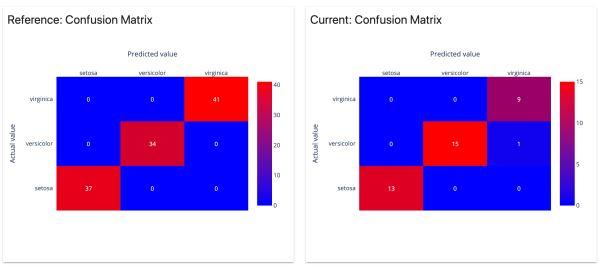
在上图中,可以清楚地看到显示模型性能的报告,可以使用上述代码下载并创建的 HTML 报告。
6、可用报告类型
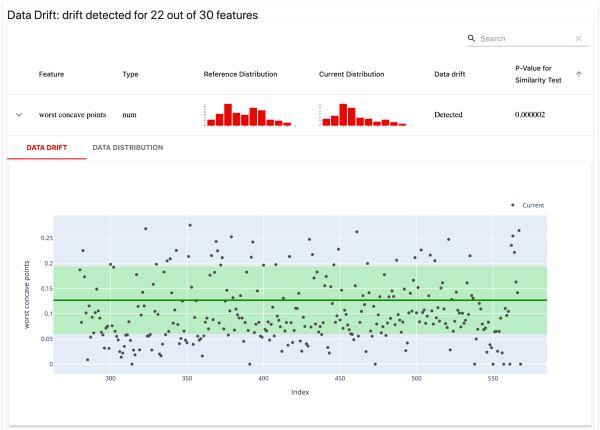
1)数据漂移
检测特征分布的变化
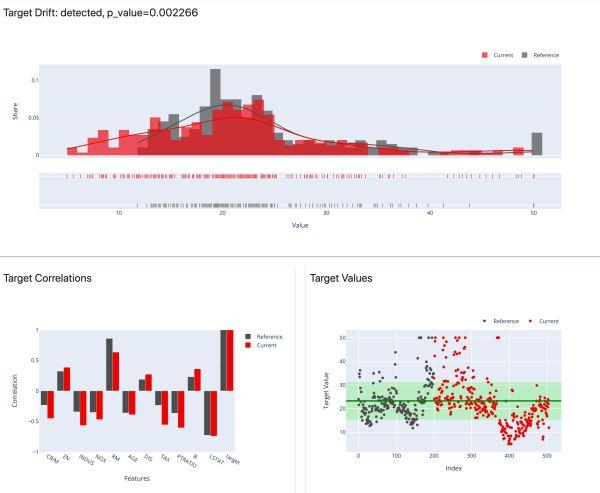
2)数值目标漂移
检测数值目标和特征行为的变化。
3)分类目标漂移
检测分类目标和特征行为的变化

4)回归模型性能
分析回归模型的性能和模型误差

5)分类模型性能
分析分类模型的性能和错误。适用于二元和多类模型
6)概率分类模型性能
分析概率分类模型的性能、模型校准的质量和模型错误。适用于二元和多类模型。

以上就是python数据挖掘使用Evidently创建机器学习模型仪表板的详细内容,更多关于Evidently创建机器学习模型仪表板的资料请关注python博客其它相关文章!
- << 上一篇 下一篇 >>
- 相关文章
- 2021-12-20python数据挖掘使用Evidently创建机器学习模型仪表板
- 2021-12-20Python多进程共享numpy 数组的方法
- 2021-12-20python数据分析近年比特币价格涨幅趋势分布
- 2021-12-20python调用matlab的方法详解
- 2021-12-20python学习与数据挖掘应知应会的十大终端命令
- 2021-07-20pandas中NaN缺失值的处理方法
- 2021-07-20Python数据分析入门之数据读取与存储
- 2021-07-20Python 如何读取字典的所有键-值对
- 2021-07-20如何获取numpy的第一个非0元素索引
- 2021-07-20Python机器学习之KNN近邻算法
-
搜索
-
-
推荐资源
-
Powered By python教程网 鲁ICP备18013710号
python博客 - 小白学python最友好的网站!