grid()函数概述
grid()函数用于设置绘图区网格线。
grid()的函数签名为matplotlib.pyplot.grid(b=None, which='major', axis='both', **kwargs)。
grid()的参数如下:b:是否显示网格线。布尔值或None,可选参数。如果没有关键字参数,则b为True,如果b为None且没有关键字参数,相当于切换网格线的可见性。which:网格线显示的尺度。字符串,可选参数,取值范围为{'major', 'minor', 'both'},默认为'both'。'major'为主刻度、'minor'为次刻度。axis:选择网格线显示的轴。字符串,可选参数,取值范围为{'both', 'x', 'y'},默认为'both'`。**kwargs:Line2D线条对象属性。
grid()的返回值为None。grid()函数演示
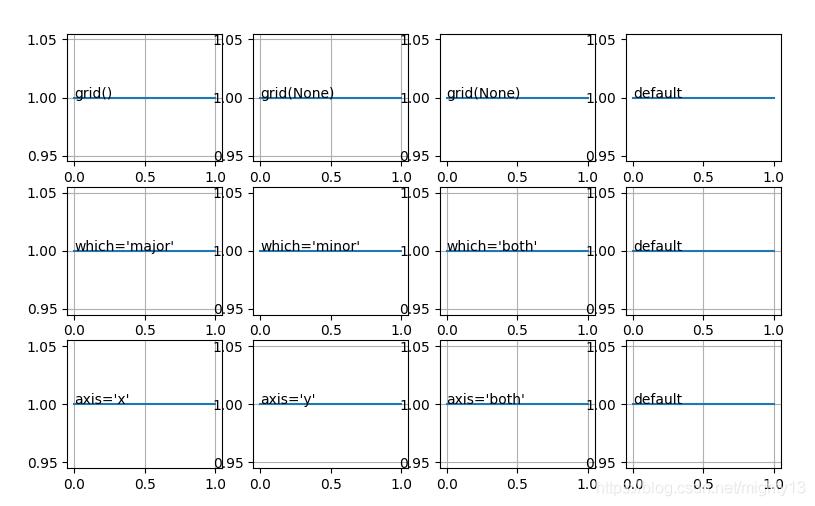
import matplotlib.pyplot as plt

plt.subplot(341)
# grid()默认样式
plt.plot([1, 1])
plt.grid()
plt.annotate('grid()', (0, 1))
plt.subplot(342)
# 因为默认没有网格线,所以grid(None)显示网格线
plt.plot([1, 1])
plt.grid(None)
plt.annotate('grid(None)', (0, 1))
plt.subplot(343)
# 因为设置了网格线,所以grid(None)切换为不显示网格线
plt.plot([1, 1])
plt.grid(True)
plt.grid(None)
plt.annotate('grid(None)', (0, 1))
plt.subplot(344)
# 因为默认没有网格线
plt.plot([1, 1])
plt.annotate("default", (0, 1))
plt.subplot(345)
# 只显示主刻度网格线
plt.plot([1, 1])
plt.grid(which='major')
plt.annotate("which='major'", (0, 1))
plt.subplot(346)
# 只显示次刻度网格线,因为没有次刻度,所以无网格线
plt.plot([1, 1])
plt.grid(which='minor')
plt.annotate("which='minor'", (0, 1))
plt.subplot(347)
# 同时显示主刻度、次刻度网格线
plt.plot([1, 1])
plt.grid(which='both')
plt.annotate("which='both'", (0, 1))
plt.subplot(348)
plt.plot([1, 1])
# 默认同时显示主刻度、次刻度网格线
plt.grid()
plt.annotate("default", (0, 1))
plt.subplot(349)
# 只显示x轴网格线
plt.plot([1, 1])
plt.grid(axis='x')
plt.annotate("axis='x'", (0, 1))
plt.subplot(3,4,10)
# 只显示y轴网格线
plt.plot([1, 1])
plt.grid(axis='y')
plt.annotate("axis='y'", (0, 1))
plt.subplot(3,4,11)
# 同时显示xy轴网格线
plt.plot([1, 1])
plt.grid(axis='both')
plt.annotate("axis='both'", (0, 1))
plt.subplot(3,4,12)
# 默认显示xy轴网格线
plt.plot([1, 1])
plt.grid()
plt.annotate("default", (0, 1))
plt.show()
原理
pyplot.grid()其实调用的是gca().grid(),即Aexs.grid()。底层相关函数有:
Axis.grid()Axes.grid()源码(matplotlib/Axes/_base.py)def grid(self, b=None, which='major', axis='both', **kwargs): cbook._check_in_list(['x', 'y', 'both'], axis=axis) if axis in ['x', 'both']: self.xaxis.grid(b, which=which, **kwargs) if axis in ['y', 'both']: self.yaxis.grid(b, which=which, **kwargs)xaxis为XAxis类的实例,yaxis为YAxis类的实例,XAxis和YAxis类的基类为Axis。Axis.grid()源码(matplotlib/axis.py)def grid(self, b=None, which='major', **kwargs): if b is not None: if 'visible' in kwargs and bool(b) != bool(kwargs['visible']): raise ValueError( "'b' and 'visible' specify inconsistent grid visibilities") if kwargs and not b: # something false-like but not None cbook._warn_external('First parameter to grid() is false, ' 'but line properties are supplied. The ' 'grid will be enabled.') b = True which = which.lower() cbook._check_in_list(['major', 'minor', 'both'], which=which) gridkw = {'grid_' + item[0]: item[1] for item in kwargs.items()} if 'grid_visible' in gridkw: forced_visibility = True gridkw['gridOn'] = gridkw.pop('grid_visible') else: forced_visibility = False if which in ['minor', 'both']: if b is None and not forced_visibility: gridkw['gridOn'] = not self._minor_tick_kw['gridOn'] elif b is not None: gridkw['gridOn'] = b self.set_tick_params(which='minor', **gridkw) if which in ['major', 'both']: if b is None and not forced_visibility: gridkw['gridOn'] = not self._major_tick_kw['gridOn'] elif b is not None: gridkw['gridOn'] = b self.set_tick_params(which='major', **gridkw) self.stale = True到此这篇关于matplotlib grid()设置网格线外观的实现的文章就介绍到这了,更多相关matplotlib grid()网格线内容请搜索python博客以前的文章或继续浏览下面的相关文章希望大家以后多多支持python博客!
-
<< 上一篇 下一篇 >>
标签:matplotlib
matplotlib grid()设置网格线外观的实现
看: 1795次 时间:2021-03-27 分类 : 数据分析
- 相关文章
- 2021-12-20python数据挖掘使用Evidently创建机器学习模型仪表板
- 2021-12-20Python多进程共享numpy 数组的方法
- 2021-12-20python数据分析近年比特币价格涨幅趋势分布
- 2021-12-20python调用matlab的方法详解
- 2021-12-20python学习与数据挖掘应知应会的十大终端命令
- 2021-07-20pandas中NaN缺失值的处理方法
- 2021-07-20Python数据分析入门之数据读取与存储
- 2021-07-20Python 如何读取字典的所有键-值对
- 2021-07-20如何获取numpy的第一个非0元素索引
- 2021-07-20Python机器学习之KNN近邻算法
-
搜索
-
-
推荐资源
-
Powered By python教程网 鲁ICP备18013710号
python博客 - 小白学python最友好的网站!