在pyplot模块中可以使用
xlabel()和ylabel()函数设置x轴y轴的标签。这两个函数的使用方法非常相似。使用xlabel()设置x轴标签
函数签名为
matplotlib.pyplot.xlabel(xlabel, fontdict=None, labelpad=None, *, loc=None, **kwargs)
参数作用及取值如下:xlabel:类型为字符串,即标签的文本。labelpad:类型为浮点数,默认值为None,即标签与坐标轴的距离。loc:取值范围为{'left', 'center', 'right'},默认值为rcParams["xaxis.labellocation"]('center'),即标签的位置。**kwargs:Text对象关键字属性,用于控制文本的外观属性,如字体、文本颜色等。
返回值为
Text对象。xlabel()相关rcParams为:#axes.labelsize: medium # fontsize of the x any y labels #axes.labelpad: 4.0 # space between label and axis #axes.labelweight: normal # weight of the x and y labels #axes.labelcolor: black #xaxis.labellocation: center # alignment of the xaxis label: {left, right, center}底层相关函数为:
Axes.set_xlabel(xlabel, fontdict=None, labelpad=None, *, loc=None, **kwargs)
Axes.get_xlabel()案例
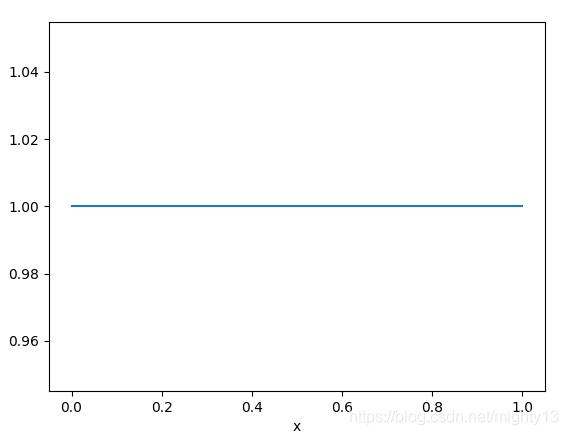
设置
x轴标签,并输出xlabel函数的返回值。
返回值为Text对象,输出返回值的属性可知,标签文本的属性为_text。如果想获取标签文本,可使用Axes.get_xlabel方法获取。import matplotlib.pyplot as plt plt.plot([1, 1]) a = plt.xlabel("x") print(a) print(vars(a)) print(a._text) print(plt.gca().get_xlabel()) plt.show()输出:
Text(0.5, 0, 'x')
{'_stale': True, 'stale_callback': None, '_axes': None, 'figure': <Figure size 640x480 with 1 Axes>, '_transform': <matplotlib.transforms.BlendedAffine2D object at 0x0000019EC1471F98>, '_transformSet': True, '_visible': True, '_animated': False, '_alpha': None, 'clipbox': None, '_clippath': None, '_clipon': True, '_label': '', '_picker': None, '_contains': None, '_rasterized': None, '_agg_filter': None, '_mouseover': False, 'eventson': False, '_oid': 0, '_propobservers': {}, '_remove_method': None, '_url': None, '_gid': None, '_snap': None, '_sketch': None, '_path_effects': [], '_sticky_edges': _XYPair(x=[], y=[]), '_in_layout': True, '_x': 0.5, '_y': 0, '_text': 'x', '_color': 'black', '_fontproperties': <matplotlib.font_manager.FontProperties object at 0x0000019EC1471BE0>, '_usetex': False, '_wrap': False, '_verticalalignment': 'top', '_horizontalalignment': 'center', '_multialignment': None, '_rotation': None, '_bbox_patch': None, '_renderer': None, '_linespacing': 1.2, '_rotation_mode': None}
x
x
使用ylabel()设置y轴标签
函数签名为
matplotlib.pyplot.ylabel(ylabel, fontdict=None, labelpad=None, *, loc=None, **kwargs)
参数作用及取值如下:ylabel:类型为字符串,即标签的文本。labelpad:类型为浮点数,默认值为None,即标签与坐标轴的距离。loc:取值范围为{'bottom', 'center', 'top'},默认值为rcParams["yaxis.labellocation"]('center'),即标签的位置。**kwargs:Text对象关键字属性,用于控制文本的外观属性,如字体、文本颜色等。
返回值为
Text对象。xlabel()相关rcParams为:#axes.labelsize: medium # fontsize of the x any y labels #axes.labelpad: 4.0 # space between label and axis #axes.labelweight: normal # weight of the x and y labels #axes.labelcolor: black #yaxis.labellocation: center # alignment of the yaxis label: {bottom, top, center}底层相关函数为:
Axes.set_ylabel(ylabel, fontdict=None, labelpad=None, *, loc=None, **kwargs)
Axes.get_ylabel()案例
添加
y轴标签,并设置字体属性和背景色。import matplotlib.pyplot as plt font = {'family': 'serif', 'color': 'darkred', 'weight': 'normal', 'size': 16, } plt.plot([1, 1]) plt.ylabel("y", fontdict=font, backgroundcolor='grey') plt.show()
到此这篇关于matplotlib之pyplot模块坐标轴标签设置使用(xlabel()、ylabel())的文章就介绍到这了,更多相关matplotlib 坐标轴标签内容请搜索python博客以前的文章或继续浏览下面的相关文章希望大家以后多多支持python博客!
-
<< 上一篇 下一篇 >>
标签:matplotlib
matplotlib之pyplot模块坐标轴标签设置使用(xlabel()、ylabel())
看: 2572次 时间:2021-03-27 分类 : 数据分析
- 相关文章
- 2021-12-20python数据挖掘使用Evidently创建机器学习模型仪表板
- 2021-12-20Python多进程共享numpy 数组的方法
- 2021-12-20python数据分析近年比特币价格涨幅趋势分布
- 2021-12-20python调用matlab的方法详解
- 2021-12-20python学习与数据挖掘应知应会的十大终端命令
- 2021-07-20pandas中NaN缺失值的处理方法
- 2021-07-20Python数据分析入门之数据读取与存储
- 2021-07-20Python 如何读取字典的所有键-值对
- 2021-07-20如何获取numpy的第一个非0元素索引
- 2021-07-20Python机器学习之KNN近邻算法
-
搜索
-
-
推荐资源
-
Powered By python教程网 鲁ICP备18013710号
python博客 - 小白学python最友好的网站!