我就废话不多说了,直接上代码吧!
from time import sleep
from threading importThread
import numpy as np
import matplotlib.pyplot as plt
from matplotlib.widgets importButton
fig, ax = plt.subplots()
#设置图形显示位置
plt.subplots_adjust(bottom=0.2)
#实验数据
range_start, range_end, range_step =0,1,0.005
t = np.arange(range_start, range_end, range_step)
s = np.sin(4*np.pi*t)
l,= plt.plot(t, s, lw=2)
#自定义类,用来封装两个按钮的单击事件处理函数
classButtonHandler:
def __init__(self):
self.flag =True
self.range_s, self.range_e, self.range_step =0,1,0.005
#线程函数,用来更新数据并重新绘制图形
def threadStart(self):
while self.flag:
sleep(0.02)
self.range_s += self.range_step
self.range_e += self.range_step
t = np.arange(self.range_s, self.range_e, self.range_step)
ydata = np.sin(4*np.pi*t)
#更新数据
l.set_xdata(t-t[0])
l.set_ydata(ydata)
#重新绘制图形
plt.draw()
defStart(self, event):
self.flag =True
#创建并启动新线程
t =Thread(target=self.threadStart)
t.start()
defStop(self, event):
self.flag =False
callback =ButtonHandler()
#创建按钮并设置单击事件处理函数
axprev = plt.axes([0.81,0.05,0.1,0.075])
bprev =Button(axprev,'Stop')
bprev.on_clicked(callback.Stop)
axnext = plt.axes([0.7,0.05,0.1,0.075])
bnext =Button(axnext,'Start')
bnext.on_clicked(callback.Start)
plt.show()
二 运行结果
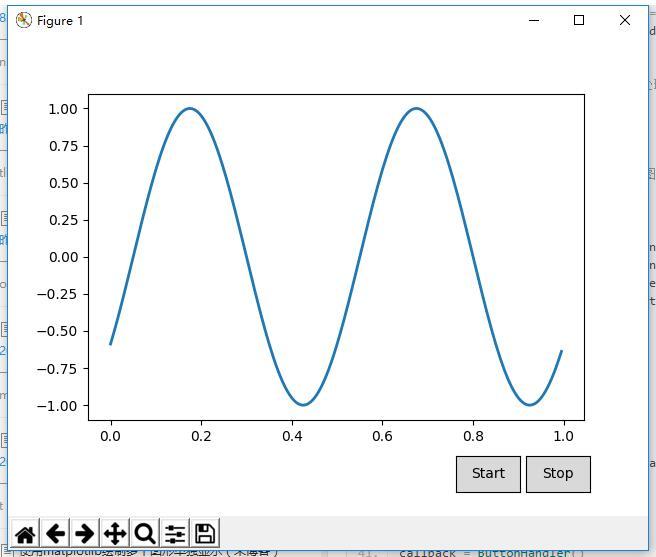
以上这篇利用matplotlib实现根据实时数据动态更新图形就是小编分享给大家的全部内容了,希望能给大家一个参考,也希望大家多多支持python博客。
-
<< 上一篇 下一篇 >>
标签:numpy matplotlib
利用matplotlib实现根据实时数据动态更新图形
看: 1786次 时间:2021-01-10 分类 : 数据分析
- 相关文章
- 2021-12-20python数据挖掘使用Evidently创建机器学习模型仪表板
- 2021-12-20Python多进程共享numpy 数组的方法
- 2021-12-20python数据分析近年比特币价格涨幅趋势分布
- 2021-12-20python调用matlab的方法详解
- 2021-12-20python学习与数据挖掘应知应会的十大终端命令
- 2021-07-20pandas中NaN缺失值的处理方法
- 2021-07-20Python数据分析入门之数据读取与存储
- 2021-07-20Python 如何读取字典的所有键-值对
- 2021-07-20如何获取numpy的第一个非0元素索引
- 2021-07-20Python机器学习之KNN近邻算法
-
搜索
-
-
推荐资源
-
Powered By python教程网 鲁ICP备18013710号
python博客 - 小白学python最友好的网站!