1、定义一个画圆的函数
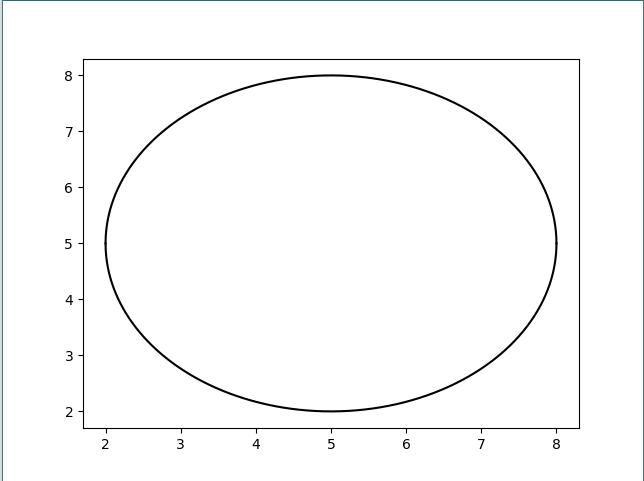
import numpy as np
import matplotlib.pyplot as plt

def plot_circle(center=(3, 3),r=2):
  x = np.linspace(center[0] - r, center[0] + r, 5000)
  y1 = np.sqrt(r**2 - (x-center[0])**2) + center[1]
  y2 = -np.sqrt(r**2 - (x-center[0])**2) + center[1]

  plt.plot(x, y1, c='k')
  plt.plot(x, y2, c='k')
  plt.show()
2、调用 plot_circle()
plot_circle((5, 5), r=3)
调整坐标轴,重新绘图
import matplotlib.pyplot as plt
plt.xlim(0, 15)
plt.ylim(0, 15)
plot_circle((5, 5),r=3)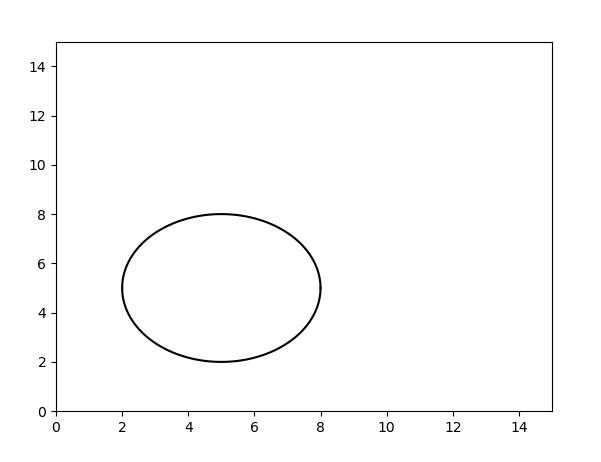
只要将步骤 1 函数定义的复杂一些,还可以实现很多玩法。
以上就是本文的全部内容,希望对大家的学习有所帮助,也希望大家多多支持python博客。
-
<< 上一篇 下一篇 >>
标签:numpy matplotlib
Python使用matplotlib绘制圆形代码实例
看: 2122次 时间:2020-07-03 分类 : 数据分析
- 相关文章
- 2021-12-20python数据挖掘使用Evidently创建机器学习模型仪表板
- 2021-12-20Python多进程共享numpy 数组的方法
- 2021-12-20python数据分析近年比特币价格涨幅趋势分布
- 2021-12-20python调用matlab的方法详解
- 2021-12-20python学习与数据挖掘应知应会的十大终端命令
- 2021-07-20pandas中NaN缺失值的处理方法
- 2021-07-20Python数据分析入门之数据读取与存储
- 2021-07-20Python 如何读取字典的所有键-值对
- 2021-07-20如何获取numpy的第一个非0元素索引
- 2021-07-20Python机器学习之KNN近邻算法
-
搜索
-
-
推荐资源
-
Powered By python教程网 鲁ICP备18013710号
python博客 - 小白学python最友好的网站!