1. Python的figure参数主要有:
def figure(num=None, # autoincrement if None, else integer from 1-N
      figsize=None, # defaults to rc figure.figsize
      dpi=None, # defaults to rc figure.dpi
      facecolor=None, # defaults to rc figure.facecolor
      edgecolor=None, # defaults to rc figure.edgecolor
      frameon=True,
      FigureClass=Figure,
      clear=False,
      **kwargs
      ):
可以设置图片大小、分辨率、颜色等。
2. subplot子图绘制,子图的绘图参数可以分别设置
plt.figure(1)

x1 = np.linspace(-0.2, 2, 10)
y1 = x1**2 + 0.3
plt.subplot(121)
plt.scatter(x1, y1)
plt.xlabel('X')
plt.ylabel('Y')
plt.title('test_1')

x2 = np.linspace(-0.2, 2, 10)
y2 = x2 + 0.3
plt.subplot(122)
plt.plot(x2, y2, color="red", linewidth=1.0, marker = 's', linestyle="--")
## plt.plot(x, y, color="#ef5492", linewidth=2.0, marker = 's', linestyle="--")
# plt.plot(x2, y2, 'rs--')

plt.xlabel('X')
plt.ylabel('Y')
plt.title('test_2')
plt.show()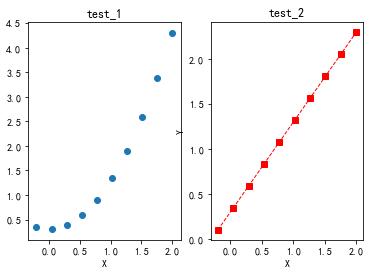
3. 在同一张图片上显示多种图形,简单说把 plt.show()放在最后即可
import matplotlib.pyplot as plt
import numpy as np
plt.figure(2)

x1 = np.linspace(-0.2, 2, 10)
y1 = x1**2 + 0.3
plt.scatter(x1, y1)


x2 = np.linspace(-0.2, 2, 10)
y2 = x2 + 0.3
plt.plot(x2, y2, color="red", linewidth=1.0, marker = 's', linestyle="--")
## plt.plot(x, y, color="#ef5492", linewidth=2.0, marker = 's', linestyle="--")
# plt.plot(x2, y2, 'rs--')

plt.xlabel('X')
plt.ylabel('Y')
plt.title('test_3')
plt.show()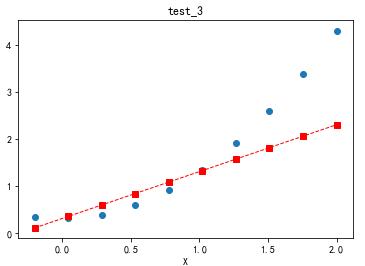
以上就是本文的全部内容,希望对大家的学习有所帮助,也希望大家多多支持python博客。
-
<< 上一篇 下一篇 >>
标签:numpy matplotlib
Python figure参数及subplot子图绘制代码
看: 1810次 时间:2020-07-17 分类 : python教程
- 相关文章
- 2021-12-20Python 实现图片色彩转换案例
- 2021-12-20python初学定义函数
- 2021-12-20图文详解Python如何导入自己编写的py文件
- 2021-12-20python二分法查找实例代码
- 2021-12-20Pyinstaller打包工具的使用以及避坑
- 2021-12-20Facebook开源一站式服务python时序利器Kats详解
- 2021-12-20pyCaret效率倍增开源低代码的python机器学习工具
- 2021-12-20python机器学习使数据更鲜活的可视化工具Pandas_Alive
- 2021-12-20python读写文件with open的介绍
- 2021-12-20Python生成任意波形并存为txt的实现
-
搜索
-
-
推荐资源
-
Powered By python教程网 鲁ICP备18013710号
python博客 - 小白学python最友好的网站!