多边形选区概述
多边形选区是一种常见的对象选择方式,在一个子图中,单击鼠标左键即构建一个多边形的端点,最后一个端点与第一个端点重合即完成多边形选区,选区即为多个端点构成的多边形。在matplotlib中的多边形选区属于部件(widgets),matplotlib中的部件都是中性(neutral )的,即与具体后端实现无关。
多边形选区具体实现定义为matplotlib.widgets.PolygonSelector类,继承关系为:Widget->AxesWidget->_SelectorWidget->PolygonSelector。
PolygonSelector类的签名为class matplotlib.widgets.PolygonSelector(ax, onselect, useblit=False, lineprops=None, markerprops=None, vertex_select_radius=15)
PolygonSelector类构造函数的参数为:
- ax:多边形选区生效的子图,类型为matplotlib.axes.Axes的实例。
- onselect:多边形选区完成后执行的回调函数,函数签名为def onselect( vertices),vertices数据类型为列表,列表元素格式为(xdata,ydata)元组。
- drawtype:多边形选区的外观,取值范围为{"box", "line", "none"},"box"为多边形框,"line"为多边形选区对角线,"none"无外观,类型为字符串,默认值为"box"。
- lineprops:多边形选区线条的属性,默认值为dict(color='k', linestyle='-', linewidth=2, alpha=0.5)。
- markerprops:多边形选区端点的属性,默认值为dict(marker='o', markersize=7, mec='k', mfc='k', alpha=0.5)。
- vertex_select_radius:多边形端点的选择半径,浮点数,默认值为15,用于端点选择或者多边形闭合。
PolygonSelector类中的state_modifier_keys公有变量 state_modifier_keys定义了操作快捷键,类型为字典。
- “move_all”: 移动已存在的选区,默认为"shift"。
- “clear”:清除现有选区,默认为 "escape",即esc键。
- “move_vertex”:正方形选区,默认为"control"。
PolygonSelector类中的verts特性返回多边形选区中的多有端点,类型为列表,元素为(x,y)元组,即端点的坐标元组。
案例
官方案例,https://matplotlib.org/gallery/widgets/polygon_selector_demo.html
案例说明
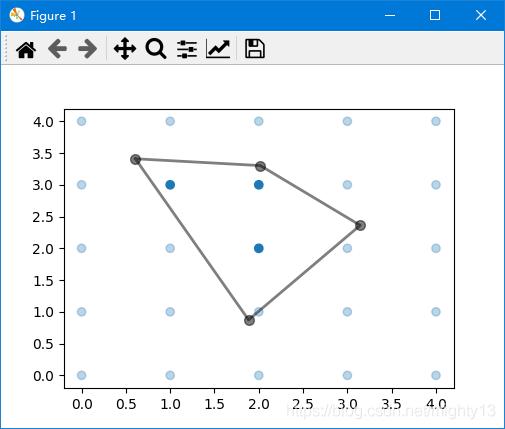
单击鼠标左键创建端点,最终点击初始端点闭合多边形,形成多边形选区。选区外的数据元素颜色变淡,选区内数据颜色保持不变。
按esc键取消选区。按shift键鼠标可以移动多边形选区位置,按ctrl键鼠标可以移动多边形选区某个端点的位置。退出程序时,控制台输出选区内数据元素的坐标。
控制台输出:
Selected points:
[[2.0 2.0]
[1.0 3.0]
[2.0 3.0]]案例代码
import numpy as np

from matplotlib.widgets import PolygonSelector
from matplotlib.path import Path


class SelectFromCollection:
  """
  Select indices from a matplotlib collection using `PolygonSelector`.

  Selected indices are saved in the `ind` attribute. This tool fades out the
  points that are not part of the selection (i.e., reduces their alpha
  values). If your collection has alpha < 1, this tool will permanently
  alter the alpha values.

  Note that this tool selects collection objects based on their *origins*
  (i.e., `offsets`).

  Parameters
  ----------
  ax : `~matplotlib.axes.Axes`
    Axes to interact with.
  collection : `matplotlib.collections.Collection` subclass
    Collection you want to select from.
  alpha_other : 0 <= float <= 1
    To highlight a selection, this tool sets all selected points to an
    alpha value of 1 and non-selected points to *alpha_other*.
  """

  def __init__(self, ax, collection, alpha_other=0.3):
    self.canvas = ax.figure.canvas
    self.collection = collection
    self.alpha_other = alpha_other

    self.xys = collection.get_offsets()
    self.Npts = len(self.xys)

    # Ensure that we have separate colors for each object
    self.fc = collection.get_facecolors()
    if len(self.fc) == 0:
      raise ValueError('Collection must have a facecolor')
    elif len(self.fc) == 1:
      self.fc = np.tile(self.fc, (self.Npts, 1))

    self.poly = PolygonSelector(ax, self.onselect)
    self.ind = []

  def onselect(self, verts):
    path = Path(verts)
    self.ind = np.nonzero(path.contains_points(self.xys))[0]
    self.fc[:, -1] = self.alpha_other
    self.fc[self.ind, -1] = 1
    self.collection.set_facecolors(self.fc)
    self.canvas.draw_idle()

  def disconnect(self):
    self.poly.disconnect_events()
    self.fc[:, -1] = 1
    self.collection.set_facecolors(self.fc)
    self.canvas.draw_idle()


if __name__ == '__main__':
  import matplotlib.pyplot as plt

  fig, ax = plt.subplots()
  grid_size = 5
  grid_x = np.tile(np.arange(grid_size), grid_size)
  grid_y = np.repeat(np.arange(grid_size), grid_size)
  pts = ax.scatter(grid_x, grid_y)

  selector = SelectFromCollection(ax, pts)

  print("Select points in the figure by enclosing them within a polygon.")
  print("Press the 'esc' key to start a new polygon.")
  print("Try holding the 'shift' key to move all of the vertices.")
  print("Try holding the 'ctrl' key to move a single vertex.")

  plt.show()

  selector.disconnect()

  # After figure is closed print the coordinates of the selected points
  print('\nSelected points:')
  print(selector.xys[selector.ind])
到此这篇关于matplotlib之多边形选区(PolygonSelector)的使用的文章就介绍到这了,更多相关matplotlib 多边形选区内容请搜索python博客以前的文章或继续浏览下面的相关文章希望大家以后多多支持python博客!
-
<< 上一篇 下一篇 >>
标签:numpy matplotlib
matplotlib之多边形选区(PolygonSelector)的使用
看: 1721次 时间:2021-03-21 分类 : python爬虫
- 相关文章
- 2021-07-20Python爬虫基础之爬虫的分类知识总结
- 2021-07-20Python爬虫基础讲解之请求
- 2021-07-20PyQt5爬取12306车票信息程序的实现
- 2021-07-20Python爬虫之m3u8文件里提取小视频的正确姿势
- 2021-07-20如何用python抓取B站数据
- 2021-07-20快速搭建python爬虫管理平台
- 2021-07-20Python爬虫之获取心知天气API实时天气数据并弹窗提醒
- 2021-07-20Python爬虫之批量下载喜马拉雅音频
- 2021-07-20python使用pywinauto驱动微信客户端实现公众号爬虫
- 2021-07-20Requests什么的通通爬不了的Python超强反爬虫方案!
-
搜索
-
-
推荐资源
-
Powered By python教程网 鲁ICP备18013710号
python博客 - 小白学python最友好的网站!