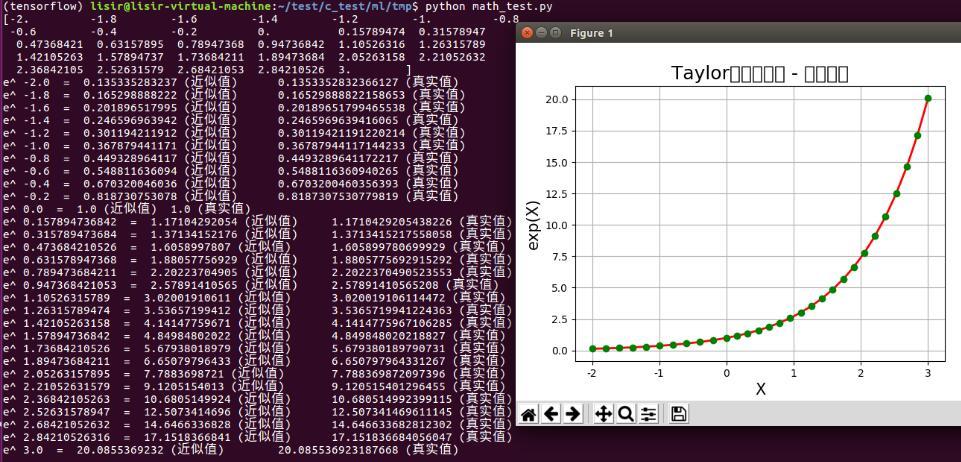
这里用Python逼近函数y = exp(x);同样使用泰勒函数去逼近:
exp(x) = 1 + x + (x)^2/(2!) + .. + (x)^n/(n!) + ...
#!/usr/bin/python
# -*- coding:utf-8 -*-

import numpy as np
import math
import matplotlib as mpl
import matplotlib.pyplot as plt


def calc_e_small(x):
 n = 10
 f = np.arange(1, n+1).cumprod()
 b = np.array([x]*n).cumprod()
 return np.sum(b / f) + 1


def calc_e(x):
 reverse = False
 if x < 0: # 处理负数
  x = -x
  reverse = True
 ln2 = 0.69314718055994530941723212145818
 c = x / ln2
 a = int(c+0.5)
 b = x - a*ln2
 y = (2 ** a) * calc_e_small(b)
 if reverse:
  return 1/y
 return y


if __name__ == "__main__":
 t1 = np.linspace(-2, 0, 10, endpoint=False)
 t2 = np.linspace(0, 3, 20)
 t = np.concatenate((t1, t2))
 print(t)  # 横轴数据
 y = np.empty_like(t)
 for i, x in enumerate(t):
  y[i] = calc_e(x)
  print('e^', x, ' = ', y[i], '(近似值)\t', math.exp(x), '(真实值)')
  # print '误差:', y[i] - math.exp(x)
 plt.figure(facecolor='w')
 mpl.rcParams['font.sans-serif'] = [u'SimHei']
 mpl.rcParams['axes.unicode_minus'] = False
 plt.plot(t, y, 'r-', t, y, 'go', linewidth=2)
 plt.title(u'Taylor展式的应用 - 指数函数', fontsize=18)
 plt.xlabel('X', fontsize=15)
 plt.ylabel('exp(X)', fontsize=15)
 plt.grid(True)
 plt.show()
以上这篇python实现画出e指数函数的图像就是小编分享给大家的全部内容了,希望能给大家一个参考,也希望大家多多支持python博客。
-
<< 上一篇 下一篇 >>
标签:numpy matplotlib
python实现画出e指数函数的图像
看: 1715次 时间:2021-02-05 分类 : python教程
- 相关文章
- 2021-12-20Python 实现图片色彩转换案例
- 2021-12-20python初学定义函数
- 2021-12-20图文详解Python如何导入自己编写的py文件
- 2021-12-20python二分法查找实例代码
- 2021-12-20Pyinstaller打包工具的使用以及避坑
- 2021-12-20Facebook开源一站式服务python时序利器Kats详解
- 2021-12-20pyCaret效率倍增开源低代码的python机器学习工具
- 2021-12-20python机器学习使数据更鲜活的可视化工具Pandas_Alive
- 2021-12-20python读写文件with open的介绍
- 2021-12-20Python生成任意波形并存为txt的实现
-
搜索
-
-
推荐资源
-
Powered By python教程网 鲁ICP备18013710号
python博客 - 小白学python最友好的网站!