项目介绍
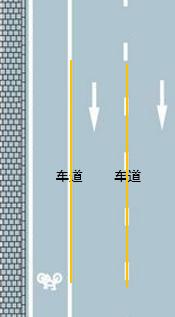
下图中的两条线即为车道:
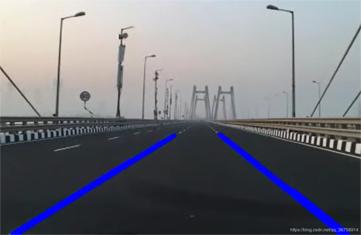
我们的任务就是通过 OpenCV 在一段视频(或摄像头)中实时检测出车道并将其标记出来。其效果如下图所示:
这里使用的代码来源于磐怼怼大神,此文章旨在对其代码进行解释。
实现步骤
1、将视频的所有帧读取为图片;
2、创建掩码并应用到这些图片上;
3、图像阈值化;
4、用霍夫线变换检测车道;
5、将车道画到每张图片上;
6、将所有图片合并为视频。
代码实现
1、导入需要的库
import os
import re
import cv2
import numpy as np
from tqdm import notebook
import matplotlib.pyplot as plt
其中 tqdm.notebook 是用来显示进度条的。
2、将图片(视频的每一帧)加载进来
这里我们已经将视频的每一帧读取为图片了,并将它们都放进 frames 文件夹。
# 获取帧的文件名
col_frames = os.listdir('frames/') # 读取 frames 文件夹下的所有图片
col_frames.sort(key=lambda f: int(re.sub('\D', '', f))) # 按名称对图片进行排序

# 加载帧
col_images=[]
for i in notebook.tqdm(col_frames):
  img = cv2.imread('frames/'+i)
  col_images.append(img) # 将所有图片添加进 col_images 列表
3、选择一张图片进行处理
3.1 选定一张图片
# 指定一个索引
idx = 457

# plot frame
plt.figure(figsize=(10,10))
plt.imshow(col_images[idx][:,:,0], cmap= "gray")
plt.show()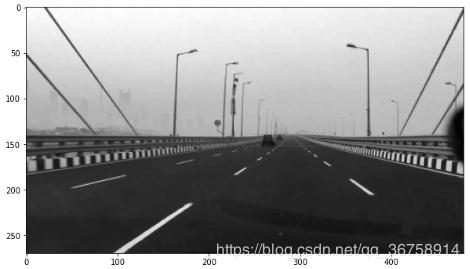
3.2 创建掩码
# 创建0矩阵
stencil = np.zeros_like(col_images[idx][:,:,0])

# 指定多边形的坐标
polygon = np.array([[50,270], [220,160], [360,160], [480,270]])

# 用1填充多边形
cv2.fillConvexPoly(stencil, polygon, 1)

# 画出多边形
plt.figure(figsize=(10,10))
plt.imshow(stencil, cmap= "gray")
plt.show()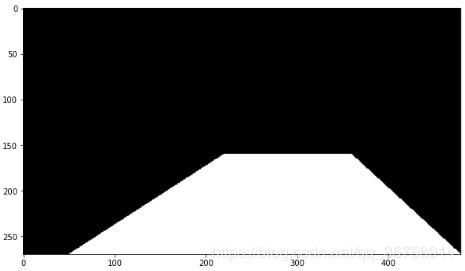
3.3 将掩码应用到图片上
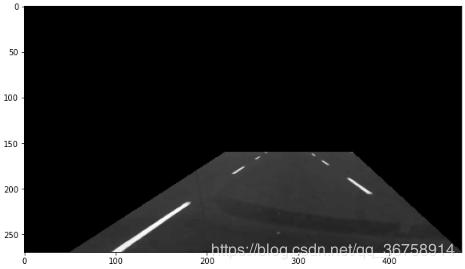
# 应用该多边形作为掩码
img = cv2.bitwise_and(col_images[idx][:,:,0], col_images[idx][:,:,0], mask=stencil)

# 画出掩码后的图片
plt.figure(figsize=(10,10))
plt.imshow(img, cmap= "gray")
plt.show()
这里的按位与操作 cv2.bitwise_and()
3.4 图像阈值化
# 应用图像阈值化
ret, thresh = cv2.threshold(img, 130, 145, cv2.THRESH_BINARY)

# 画出图像
plt.figure(figsize=(10,10))
plt.imshow(thresh, cmap= "gray")
plt.show()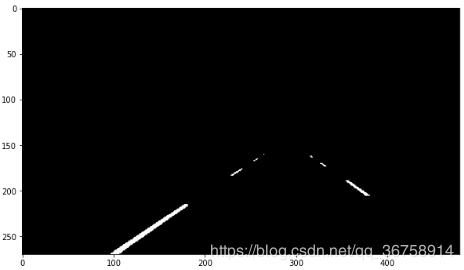
3.5 霍夫线变换检测车道
lines = cv2.HoughLinesP(thresh, 1.0, np.pi/180, 30, maxLineGap=200)

# 创建原始帧的副本
dmy = col_images[idx][:,:,0].copy()

# 霍夫线
for line in lines:
  x1, y1, x2, y2 = line[0] # 提取出霍夫线的坐标
  cv2.line(dmy, (x1, y1), (x2, y2), (255, 0, 0), 3) # 将霍夫线画在帧上

# 画出帧
plt.figure(figsize=(10,10))
plt.imshow(dmy, cmap= "gray")
plt.show()
cv2.HoughLinesP() 函数介绍:
lines = HoughLinesP(image, rho, theta, threshold, minLineLength=None, maxLineGap=None)
输入:
- image: 必须是二值图像;
- rho: 线段以像素为单位的距离精度,double类型的,推荐用1.0
- theta: 线段以弧度为单位的角度精度,推荐用numpy.pi/180
- threshod: 累加平面的阈值参数,int类型,超过设定阈值才被检测出线段,值越大,基本上意味着检出的线段越长,检出的线段个数越少。
- minLineLength:线段以像素为单位的最小长度。
- maxLineGap:同一方向上两条线段判定为一条线段的最大允许间隔,超过了设定值,则把两条线段当成一条线段。
输出:
lines:一个三维矩阵,其形状符合 (m, 1, n),其中 m 表示直线个数,n 表示每条直线的两端坐标。

4、对每张图片进行上一步骤的处理后写入视频
4.1 定义视频格式
# 输出视频路径
pathOut = 'roads_v2.mp4'

# 视频每秒的帧数
fps = 30.0

# 视频中每一帧的尺寸
height, width = img.shape
size = (width,height)

# 写入视频
out = cv2.VideoWriter(pathOut,cv2.VideoWriter_fourcc(*'DIVX'), fps, size)
4.2 处理所有图片并写入视频文件
for img in notebook.tqdm(col_images):

  # 应用帧掩码
  masked = cv2.bitwise_and(img[:,:,0], img[:,:,0], mask=stencil)

  # 应用图像阈值化
  ret, thresh = cv2.threshold(masked, 130, 145, cv2.THRESH_BINARY)

  # 应用霍夫线变换
  lines = cv2.HoughLinesP(thresh, 1, np.pi/180, 30, maxLineGap=200)
  dmy = img.copy()

  #画出检测到的线
  try:
    for line in lines:
      x1, y1, x2, y2 = line[0]
      cv2.line(dmy, (x1, y1), (x2, y2), (255, 0, 0), 3)

    out.write(dmy)

  except TypeError:
    out.write(img)

out.release()
完整代码
import os
import re
import cv2
import numpy as np
from tqdm import notebook
import matplotlib.pyplot as plt

col_frames = os.listdir('frames/')
col_frames.sort(key=lambda f: int(re.sub('\D', '', f)))

col_images=[]
for i in notebook.tqdm(col_frames):
  img = cv2.imread('frames/'+i)
  col_images.append(img)

stencil = np.zeros_like(col_images[0][:,:,0])
polygon = np.array([[50,270], [220,160], [360,160], [480,270]])
cv2.fillConvexPoly(stencil, polygon, 1)

pathOut = 'roads_v2.mp4'

fps = 30.0

height, width = img.shape
size = (width,height)

out = cv2.VideoWriter(pathOut,cv2.VideoWriter_fourcc(*'DIVX'), fps, size)

for img in notebook.tqdm(col_images):

  masked = cv2.bitwise_and(img[:,:,0], img[:,:,0], mask=stencil)

  ret, thresh = cv2.threshold(masked, 130, 145, cv2.THRESH_BINARY)

  lines = cv2.HoughLinesP(thresh, 1, np.pi/180, 30, maxLineGap=200)
  dmy = img.copy()

  try:
    for line in lines:
      x1, y1, x2, y2 = line[0]
      cv2.line(dmy, (x1, y1), (x2, y2), (255, 0, 0), 3)

    out.write(dmy)

  except TypeError:
    out.write(img)

out.release()
到此这篇关于使用OpenCV对车道进行实时检测的实现示例代码的文章就介绍到这了,更多相关OpenCV 车道实时检测内容请搜索python博客以前的文章或继续浏览下面的相关文章希望大家以后多多支持python博客!
-
<< 上一篇 下一篇 >>
标签:numpy matplotlib
使用OpenCV对车道进行实时检测的实现示例代码
看: 1684次 时间:2020-09-11 分类 : python教程
- 相关文章
- 2021-12-20Python 实现图片色彩转换案例
- 2021-12-20python初学定义函数
- 2021-12-20图文详解Python如何导入自己编写的py文件
- 2021-12-20python二分法查找实例代码
- 2021-12-20Pyinstaller打包工具的使用以及避坑
- 2021-12-20Facebook开源一站式服务python时序利器Kats详解
- 2021-12-20pyCaret效率倍增开源低代码的python机器学习工具
- 2021-12-20python机器学习使数据更鲜活的可视化工具Pandas_Alive
- 2021-12-20python读写文件with open的介绍
- 2021-12-20Python生成任意波形并存为txt的实现
-
搜索
-
-
推荐资源
-
Powered By python教程网 鲁ICP备18013710号
python博客 - 小白学python最友好的网站!