在拿到数据后,最需要做的工作之一就是查看一下自己的数据分布情况。而针对数据的分布,又包括pdf和cdf两类。
下面介绍使用python生成pdf的方法:
使用matplotlib的画图接口hist(),直接画出pdf分布;
使用numpy的数据处理函数histogram(),可以生成pdf分布数据,方便进行后续的数据处理,比如进一步生成cdf;
使用seaborn的distplot(),好处是可以进行pdf分布的拟合,查看自己数据的分布类型;
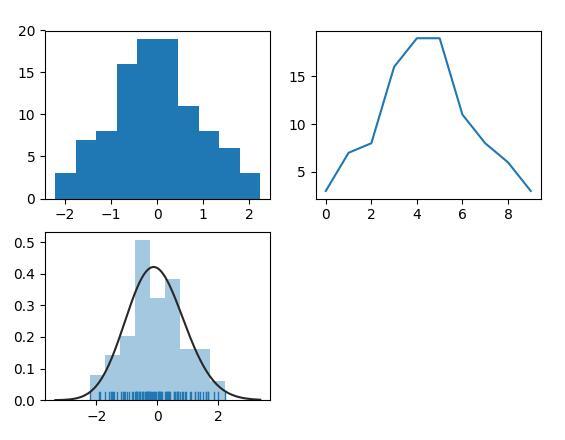
上图所示为采用3种算法生成的pdf图。下面是源代码。
from scipy import stats
import matplotlib.pyplot as plt
import numpy as np
import seaborn as sns

arr = np.random.normal(size=100)

# plot histogram
plt.subplot(221)
plt.hist(arr)

# obtain histogram data
plt.subplot(222)
hist, bin_edges = np.histogram(arr)
plt.plot(hist)

# fit histogram curve
plt.subplot(223)
sns.distplot(arr, kde=False, fit=stats.gamma, rug=True)
plt.show()
下面介绍使用python生成cdf的方法:
使用numpy的数据处理函数histogram(),生成pdf分布数据,进一步生成cdf;
使用seaborn的cumfreq(),直接画出cdf;
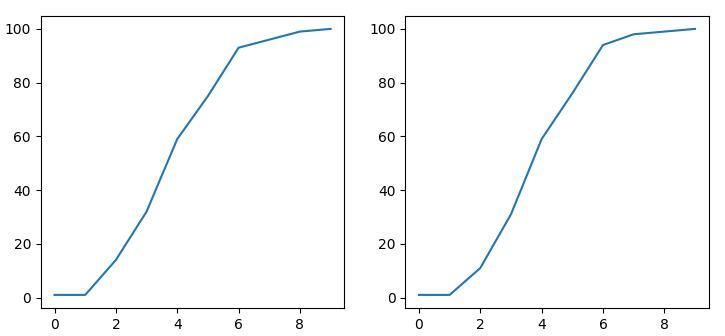
上图所示为采用2种算法生成的cdf图。下面是源代码。
from scipy import stats
import matplotlib.pyplot as plt
import numpy as np
import seaborn as sns

arr = np.random.normal(size=100)

plt.subplot(121)
hist, bin_edges = np.histogram(arr)
cdf = np.cumsum(hist)
plt.plot(cdf)

plt.subplot(122)
cdf = stats.cumfreq(arr)
plt.plot(cdf[0])

plt.show()
在更多时候,需要把pdf和cdf放在一起,可以更好的显示数据分布。这个实现需要把pdf和cdf分别进行归一化。
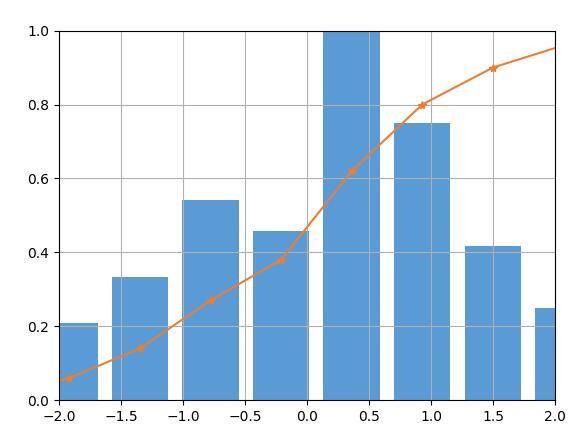
上图所示为归一化的pdf和cdf。下面是源代码。
from scipy import stats
import matplotlib.pyplot as plt
import numpy as np
import seaborn as sns

arr = np.random.normal(size=100)

hist, bin_edges = np.histogram(arr)
width = (bin_edges[1] - bin_edges[0]) * 0.8
plt.bar(bin_edges[1:], hist/max(hist), width=width, color='#5B9BD5')

cdf = np.cumsum(hist/sum(hist))
plt.plot(bin_edges[1:], cdf, '-*', color='#ED7D31')

plt.xlim([-2, 2])
plt.ylim([0, 1])
plt.grid()

plt.show()
以上这篇Python处理PDF与CDF实例就是小编分享给大家的全部内容了,希望能给大家一个参考,也希望大家多多支持python博客。
-
<< 上一篇 下一篇 >>
标签:numpy matplotlib
Python处理PDF与CDF实例
看: 1831次 时间:2020-08-10 分类 : python教程
- 相关文章
- 2021-12-20Python 实现图片色彩转换案例
- 2021-12-20python初学定义函数
- 2021-12-20图文详解Python如何导入自己编写的py文件
- 2021-12-20python二分法查找实例代码
- 2021-12-20Pyinstaller打包工具的使用以及避坑
- 2021-12-20Facebook开源一站式服务python时序利器Kats详解
- 2021-12-20pyCaret效率倍增开源低代码的python机器学习工具
- 2021-12-20python机器学习使数据更鲜活的可视化工具Pandas_Alive
- 2021-12-20python读写文件with open的介绍
- 2021-12-20Python生成任意波形并存为txt的实现
-
搜索
-
-
推荐资源
-
Powered By python教程网 鲁ICP备18013710号
python博客 - 小白学python最友好的网站!